Thursday, December 13, 2018

What will Happen at Data Workshop for Teachers January 4th?


First Year Teachers work with Harvard Forest Data Manager, Emery Boose


Emery Boose will present an overview of how Schoolyard Ecology data is managed using the Harvard Forest Schoolyard Eco. Online Database. 


Level I teachers will learn how to 
use the Harvard Forest online 
graphing tools to represent their
project data.


First year teachers will have an oportunityto input their project data with support of Harvard Forest mentors.

Experienced Teachers work with Ecologist, Betsy Colburn to learn how to look at their project Data.  

 
 How to organize data into tables and graphs in order to see what the data is saying.


Harvard Forest Mentors work side by side with
teachers to support them in reaching their
graphing goals.


 Level II Teachers will practice graphing
Schoolyard Data using a set of structured
graphing activities to learn graphing skills and
see examples of the kinds of graphs that
work well for representing their data.


Level III Teachers will will work on their
individual predetermined graphing goals.
Harvard Forest Mentors will help trouble
shoot and offer advice in achieving those
goals in best organizing and representing their
data.


AGENDA for Jan. 4th Workshop:


 TO REGISTER:

Email Pamela Snow, Harvard Forest Schoolyard Ecology Coordinator with your Project name, School name and the Level you want to register for.

Registration Deadline is Tuesday, December  18th.


Monday, December 10, 2018

Collaboration and Outreach from California to Connecticut


Spreading the Word and Sharing Inspiration with Educators from all over the Country and Back Home in New England

Long Term Ecological Research (L.T.E.R.) Network

 All Scientists Meeting 


Pacific Grove, California                                              September 29-October 4, 2018


Harvard Forest  Director of Education, Clarisse Hart, announced the winners of the  national Undergraduate Poster Contest to over 400 participants in the LTER A.S.M.   She helped organize in honor of former Virginia Coastal LTER Educator, Arthur Schwarzschild.


Teacher, Melanie McCracken, of Groton-Dunstable H.S. presented  how she engages students in working with data from the HF Schoolyard Ecology  "Buds, Leaves and Global Warming" project.  Melanie showed examples of how students struggle to accurately record and represent project data. She discussed strategies she uses to improve data literacy among her students, as part of a conference workshop focused on Data Literacy.


A Teacher from the Luquillo LTER site  also shared her strategies in using LTER Education projects to enhance data literacy among her High School Students in Puerto Rico.   


A mix of Educators, Scientists, Data Managers and Graduate Students participated in this series of  workshops organized by the  LTER Ed. and Outreach Committee.  HF Data Manager, Emery Boose, Project Coach, Fiona Jevon, and Schoolyard Coordinator, Pamela Snow also participated in these workshops.  


And, Yes, we got to play outside too!  Scott Simon of the Santa Barbara Coastal LTER, led the Education group in a hands on exploration of tide pools.


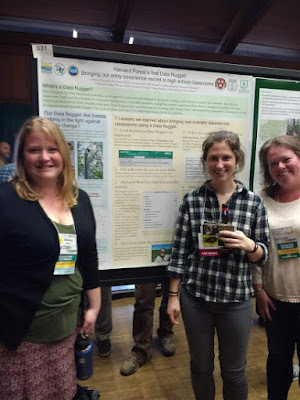
"Our Changing Forests" Project Coach, Fiona Jevon, (center of left photo) shares her Poster about the process of creating a "Data Nugget" lesson plan about Harvard Univ. Scientist, Bill Munger's, Eddy Flux Tower Research. Data Nugget Staff Melissa and Elizabeth are pictured on either side of Fiona.

The link to this Data Nugget can be found at:  DataNuggets.org/2018/08/harvard-forest-climate-change/


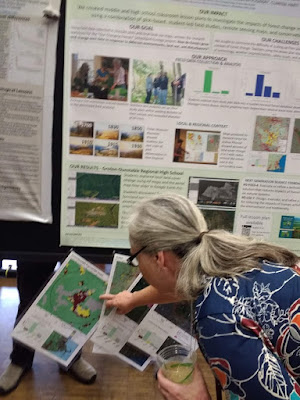
Audrey Barker-Plotkin-Senior Ecologist, (right photo) Site Manager and "Our Changing Forests" Project Ecologist shared a poster showing a summary of major research and education efforts at Harvard Forest.


 Groton Dunstable H.S. Teacher, Melanie McCracken shared a poster about her work developing curricula to broaden understanding of land use change from study plot  to town scale, using a combination of Harvard Forest-created Land Use Change Maps for her schoolyard and town as well as online tools such as Google Earth time slider, etc.

This curricular unit and others using these maps can be found on our website at:

 McCracken-YourTownHowWillitGrow- Map Curricula-2018.pdf


 For More on the LTER Network go to :

Back East


 Glen Urquhart School Teacher, Emilie Cushing, presenting at the Mass.  Assoc. of Science  Teachers  Conference in November.

Conference attendees participated in a hands-on activity calculating the approximate amount of carbon being stored in a variety of schoolyard sites  in Massachusetts and Connecticut using a learning activity developed by Emilie through the Schoolyard Ecology program.

GIS maps of Land Cover Change, that were used for this activity, were created by Research Assistant Joshua Plisinski from the Future Landscape Scenarios lab run by Ecologist, Jonathan Thompson.

Massachusetts  Association of Science Teachers Conference
Boxborough, Ma.
November  2018

 Connecticut

Belchertown High School Teacher, Louise Levy shared her land cover change activities at the  Connecticut Science Teachers Association Conference in Southbury, Ct.

This activity also involved calculating the amount of carbon being stored in schoolyards and towns using the GIS Land Cover Change Maps generated at Harvard Forest.

Louise also brought in other complimentary learning activities related to land use and mapping to build understanding around these themes.

Find Out More at:


Your Town; How Will it Grow? Lesson Plan. Mccracken-2018.pdf


Broadening Student Understanding Lesson Plan-Cushing-2018.pptx


Making Sense of Land Use Maps Lesson Plan. Levy-2018


The New England Landscape Futures Project


Connecticut Science Teachers Association Web Page


Mass. Association of Science Teachers Web Page


 Long Term Ecological Network (LTER) Website


Many thanks to our funders, The National Science Foundation LTER Program; The Highstead Foundation, and Private Donors for allowing us to participate in these conferences. 

--------------------------------------------------------------------------------------------------------

STAY TUNED....

Looking at Data, Teacher Workshop coming up at Harvard Forest Jan. 4, 2018


Thursday, September 20, 2018

What's New Woolly Bully? New teachers, students, resources to track the Hemlock Woolly Adelgid


Harvard Forest Ecologist, David Orwig has begun his 15th year of training teachers to bring their students outside their schools to help contribute to tracking a giant tree killer.
That is a tiny insect that can bring down giant Hemlock trees. 


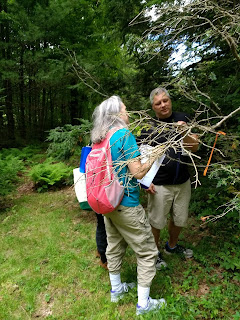
Dr. Orwig shows  Mass. Audubon Educator Kristen Steinmetz and Innovation Academy Charter School teacher Katharine Hinkle how to identify the white covered eggs sacs that the invasive
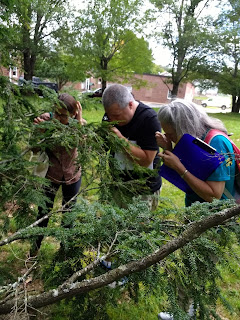
Hemlock Woolly Adelgid produces.  The covering is a wool-like substance that give the insect its name.   Teachers used hand lenses to view the insect in the field.


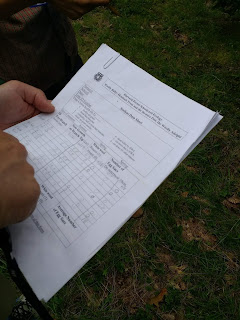
Dr. Orwig shows teachers the field sheets he has been using to track the populations of Woolly Adelgid on trees right outside Shaler Hall at Harvard Forest.  Teachers learned how to mark study branches with flagging tape and how to collect and report the data for this citizen science project.


Teachers were able to view the Adelgid under a microscope to see it much more clearly.  Dr. Orwig reviewed the life cycle of this unusual organism.


 J.R. Briggs Elementary teacher, right, shared her 13 years of experience leading this field study with teachers who will begin this study for the first time this season.   Tara DiGiovanni from the Greenfield Middle School is one of the many teachers who have been supported by Kate's mentoring through the years.


Teachers were able to see the impact the woolly Adelgid has had on a variety of Eastern Hemlock Trees at Harvard Forest, both in a landscaped area near Shaler Hall and in a Hemlock dominated forest stand.


Looking at annual growth scars to see how  much growth occurred this past year. 


Teachers practiced measuring new growth so they can go back to their schools and train
students how to collect and report data according to the scientific protocol for the Woolly Bully and the Hemlock Tree Schoolyard Ecology project.  Their data will later be shared online using the HF Schoolyard Online Database.

Explore More:


Project Connections with Next Generation Science (NGSS)  


NGSS Core Discipline: Life Science:

LS1: From Molecules to Organisms: Structures and Processes

Develop a model to describe the movement of matter among plants, animals, decomposers, and the environment

  • Elementary School (3-5) 
Reproduction is essential to the continued existence of every kind of organism. Plants and animals have unique and diverse life cycles.
  • Middle School (6-8)
Organisms reproduce, either sexually or asexually, and transfer their genetic information to their offspring.
Animals engage in characteristic behaviors that increase the odds of reproduction.
Plants reproduce in a variety of ways, sometimes depending on animal behavior and specialized features for reproduction.
Genetic factors as well as local conditions affect the growth of the adult plant.

Elementary School

NGSS Standard LS2-1


Middle School

  • Construct an explanation that predicts patterns of interactions among organisms across multiple ecosystems.
  • Next Generation Science Standard: MS-LS2-5. Evaluate competing design solutions for maintaining biodiversity and ecosystem services.

High School

  • Design, evaluate, and refine a solution for reducing the impacts of human activities on the environment and biodiversity.
  • Science and Engineering Practices

The practices describe behaviors that scientists engage in as they investigate and build models and theories about the natural world and the key set of engineering practices that engineers use as they design and build models and systems. The NRC uses the term practices instead of a term like “skills” to emphasize that engaging in scientific investigation requires not only skill but also knowledge that is specific to each practice.
Scientists and engineers plan and carry out investigations in the field or laboratory, working collaboratively as well as individually. Their investigations are systematic and require clarifying what counts as data and identifying variables or parameters.
Scientific investigations produce data that must be analyzed in order to derive meaning. Because data patterns and trends are not always obvious, scientists use a range of tools—including tabulation, graphical interpretation, visualization, and statistical analysis—to identify the significant features and patterns in the data. Scientists identify sources of error in the investigations and calculate the degree of certainty in the results. Modern technology makes the collection of large data sets much easier, providing secondary sources for analysis.
In both science and engineering, mathematics and computation are fundamental tools for representing physical variables and their relationships. They are used for a range of tasks such as constructing simulations; statistically analyzing data; and recognizing, expressing, and applying quantitative relationships.

Tuesday, June 26, 2018

Athol-Royalston Middle School Experiences Our Changing Forests Field Trip Style


Athol-Royalston Middle School Seventh Graders in Mr. Sautter's Science classes visited Harvard Forest this Spring to learn about how forests change over time.


Our Changing Forests Field Work


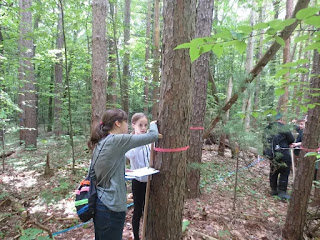
Students measured the diameter of trees
in  10 x 10 meter study plots at Harvard Forest
 for the Our Changing Forests
Schoolyard Ecology project. 


Some interesting discoveries near the study plots included a tree frog, mushroom, Red Eft Salamander and oak gall.


We learned about major changes happening in this part of the forest.  In looking up to estimate the percent of canopy cover for the field survey, we saw that many of the biggest trees in the plot were dying.  This was an old Red Pine plantation that was planted when Harvard Forest was a Forestry School.  As the the old plantation trees are dying and other species are finding enough light to sprout and grow


 Hemlock and Oak are some of the new species growing as the dying Red Pine open up the forest floor.


We looked at the difference between red and white pine cones and needles.


We recorded whether we saw snapped trees and/or uprooted trees as indicators of weather damage in our study plots.


Left: We recorded signs of Wildlife such as this stash of pine cones indicating that a squirrel or chipmunk has been looking for pine cone seeds.  

Right:  We tasted the wintergreen flavor of the  inner bark of the Sweet Birch trees near the plot.  


Fisher Museum Dioramas

Students also had a chance to learn more about Land Use Change by seeing the story of how the forests were cleared in the 1700-1800s and began to grow back again  after farm abandonment later on.   First dominated by White Pine, cut again and then grew as Hardwood dominated forests. 


Thanks to ARMS PTO representative, Stacey Bellabarba and staff person, Elaine Gauthier for photo contributions.


What does the Data Show?


 Red Pine, Red Oak and Red Maple are storing lots of Carbon presently as Red Pine continue to dominate this area of the forest.  Also there is not much species diversity in these plots due to its history as a plantation.  It will be interesting to see that as the forest is left unmanaged by humans, how the species dynamics and growth will change over time.  As we collect data over time, I would expect that Red Pine bars will become shorter and shorter, and other species will become larger. I would also expect that some species not yet represented here, will begin to sprout and grow in these plots. Therefore I would expect more bars to appear on future graphs. However disease and weather can cause unexpected "disturbance" in the forest at any time, so stay tuned by checking our database over time to track future changes.


Thanks to Highstead Foundation for Supporting this field trip with funding for the Our Changing Forests Field Trip Scholarship.


Explore More:


To Graph More Data choose Our Changing Forests project and choose field sites 5-8 on our online database.

Download Data to see the data in table form. 

Check out our Interactive Field Site Map to see all Schoolyard Ecology Field Sites that are contributing to our studies. You can select Our Changing Forests to see only those schools participating in this particular study.


Go to  Our Changing Forests Project Webpages to learn more about the Our Changing Forests project and protocol.

Attend our Summer Institute for Teachers on August 22, 2018.  
To join our Network of Schoolyard Ecology, we invite teachers from throughout the North East to 


 Apply for a   Field Trip Scholarship