Schoolyard Ecology participants continue to contribute to the larger picture of how the tiny Hemlock Woolly Adelgid is impacting one of our most common trees.
Harvard Forest Field Trip
Photos by Karen Anderson
Students from the MacDuffie School in Granby, Ma. visited Harvard Forest this spring to meet Schoolyard Ecology Project Ecologist, David Orwig in person. David showed students what the Hemlock Woolly Adelgid looked like on trees at Harvard Forest and up close under the microscope to better understand the lifecycle of the invasive species that is causing significant change in New England Forests right now.
David Orwig provided the following update about his hemlock woolly adelgid research here at Harvard Forest:
A field
mortality survey was conducted during the summer of 2016 in 4 of the 35
hectares of forest in the megaplot on Prospect Hill, around the hemlock
eddy flux tower. Findings suggests that areas of Harvard Forest are
already experiencing a rapid loss of hemlocks as a result of the invasive
insect. Since 2010, over 400 hemlock stems (20% of sampled stems) have died
within this area. In addition, recent work by Dave, Emery, and
researchers from Umass Boston, Indiana University, and Harvard University, have
shown that this decline and loss of hemlock has started to have an impact on
water- in this case the amount of water has
actually increased in local forest streams – a boost of about 15 percent. The
dying hemlocks are producing less food, using less water, and therefore
evaporating less water back to the atmosphere, leaving more water available in
streams. But like most environmental change, this effect is not likely to
stay the same for long. Hemlock trees, with their evergreen needles, are
relatively efficient water users. As hemlocks die, birch trees often grow to
replace them. Birches use far more water, especially during the height of the
growing season. Birch seedlings are already becoming established
underneath the dying hemlocks, and if these hardwood trees replace the
hemlocks, they may lead to drier conditions and less water in the streams,
particularly in mid-summer. Read the full scientific paper in Geophysical Research Letters:
Schoolyard Ecology Student Projects
MacDuffie School Students constructed mini-bioramas of particular biomes studied in Environmental Science class
 |
| Biorama by Shane Cauley |
 |
| Temperate Forest by Taeyoung Ahn |
 |
| Tropical Rainforest Biorama by Prin Jitroongruangchai |
 |
Polar Ice Biorama by Alexa Dermody and
Maddy Levesque |
 |
| Desert Biome by Wei Zhang |
 |
Taiga Biorama by Evan Murdock
and Donovan Richardson |
Schoolyard Ecology teacher, Karen Anderson led this project as a way of introducing biomes and ecosystems to students. This seems like a great way that teachers can integrate the experience of viewing the Harvard Forest dioramas into classroom work and learn about a wide variety of biomes including temperate forests that are home to the Eastern Hemlock.
For this project, students used various animal figures and
plant/soil material that was glued/painted in place to resemble the real life
biome. Keystone plants and animals were shown/listed for each biome. Students were required to learn the various abiotic
factors that were characteristic of their biome.
Student Projects from Other Schools
 |
Invasive Species iMovie Trailer by Colrain Central School Students
Colrain Central School Art Teacher, Anne Larsen, took a page from her Schoolyard Ecology Mentor Teacher, Kate Bennett, in leading her students in creating this invasive species movie trailer. It is worth taking a moment to view both Anne and Kate's students iMovie videos on the links below.
|
 |
| "The Infestation" imovie Trailer by J.R. Briggs Elementary Students |
 |
| "Invasive Species" Movie Trailer by J.R. Briggs Elementary Students |
iMovie Video Links:
Student Project- Invasive Species Movie Trailer-Larsen-2017.mp4
Student Project- "The Infestation" iMovie Trailer-Bennett
Invasive Species iMovie Trailer-Bennett
New Cross-site and Annual Summary Data Online Graphing Tools Available:

The graph above was created using the new online graphing tool that allows one to quickly and easily graph data across sites. I have chosen to graph the amount of HWA eggs recorded at all sites over the duration of the HWA Schoolyard project. As you can see, we are not yet showing any overall patterns across our schoolyard study sites.
Please keep in mind that most schools did not continue this study over more than 2-3 years and thus were not able to capture the long term progression of the adelgid over time. Perhaps more than any other plea we can make to schools is that sticking with the project over time is important. Schools do indeed have something to offer to the larger effort to see and track the regional changes in our forests over time. Any time students can contribute new data each year over a series of 5 or more years, we all benefit. A number of sites have not ever seen presence of the adelgid and therefore we see most data points at zero along the bottom of the graph. Zeros are just as important as other data to show us where adelgid has not changed the health of hemlock trees.
By pulling out only those schools who have participated for four or more years in the Woolly Bully study, we can see the stories as they are playing out over time a bit more clearly. In particular we can see that the pink line shows the MacDuffie School when it was located in Springfield, Ma. where both HWA and a tornado gave the Hemlocks a one two punch that led to dramatic decline in hemlock populations there. See more on this below. The green line show the Helen E. James School in Williamsburg, Ma. (near Northampton) where Kindergarten students have been monitoring a single hemlock tree over 6 years to show a dramatic increase in adelgid populations to the highest levels of any trees in our broader Schoolyard study. This past year saw adelgid numbers drop. I can't help but wonder what next year will show. Again the strongest lines are at zero level, showing that most of our sites are still not being impacted by the adelgid, which is somewhat surprising given the amount of mortality Harvard Forest researchers are seeing across New England.

In addition to the Helen E. James School, the J.R. Briggs site shows the expected trend.
This new graphing tool can also help show summary data for individual sites in order to capture the trend for that site. We can see here that the J.R. Briggs Schoolyard site along with Helen James school in the earlier graph shows a pattern in the graph above that we might expect to see. No Adelgid was found between 2005 and 2012. Suddenly, Adelgid was seen in 2014, and continued to be present in in 2015 and 2016, although not increasing in numbers on these particular study tree branches. If we had more study sites tracking Adelgid over this many years, our overall data would be much more likely to show similar trends.

Many sites in northern New England are not yet impacted by the Adelgid. Notice that no eggs have been observed at the Toy Town Elementary School in Winchendon, Ma. on the N.H. border, after 6 years of study. As we collect more and more data over more years and across more sites, we can better put together a picture of how, when and where the Adelgid is changing the health of one of the most common foundation trees in our forest today. Will future Schoolyard data show the adelgid continuing to move north as weather presumably continues to warm?

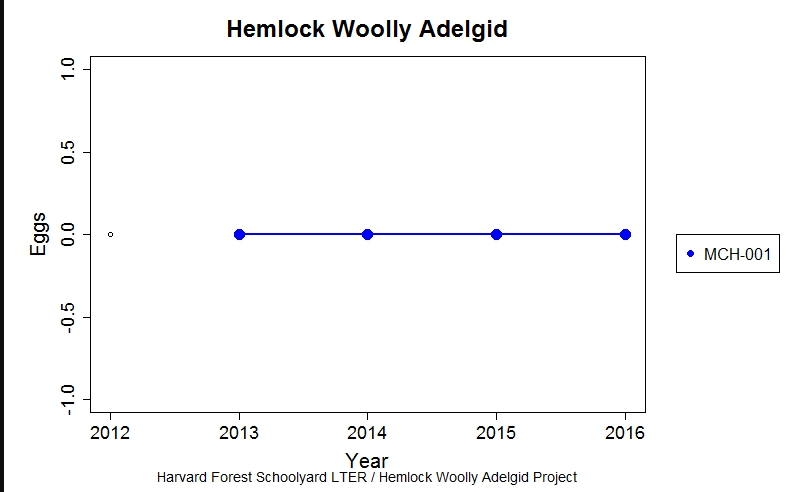
Notice that this graph above is showing a decrease in the amount of HWA eggs seen at the MacDuffie School field site in Springfield, MA. This is the opposite pattern we might expect in New England as a whole, where researchers such as David Orwig have seen an increase in the presence of the Adelgid overtime. What then can explain this downward trend in number of adelgids at this location? Note that Springfield MA. was one of the first places where the Adelgid was found in Massachusetts, crossing along the Connecticut River Valley from Connecticut. In 2009, there were already substantial numbers of Adelgid present there. As the study trees at this site began to die from infestation, fewer eggs were found. To make matters worse at this particular location, a tornado hit in 2011, bringing down all the trees at this site.
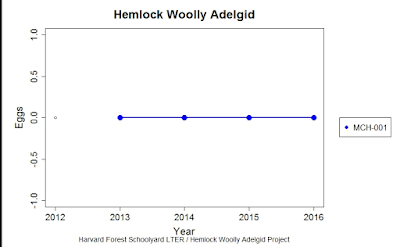
The MacDuffie School itself up and moved to another town, Granby, Ma. where they have not yet found evidence of the Adelgid. Graphs of the data from their new site are all zeros so far, which is somewhat surprising given its southerly location, but it goes to show that not all hemlocks in southern Mass. have been infested yet. It remains to be seen how many hemlocks will go unaffected by this invasive insect.
Stay Tuned for the rest of this story as students from more locations continue to provide us more and pieces of the larger picture over time as they contribute data to the Woolly Bully and the Hemlock Trees Schoolyard Ecology study.
Learn More about the Woolly Bully Studies at Harvard Forest and Related Schoolyard Sites:
David Orwig Hemlock Woolly Adelgid Research Webpages
HF Schoolyard Ecology Woolly Bully and the Hemlocks Webpages
Hemlock Adelgid Cross-Site Online Graphing Tool


