What will the Day Look Like?
New And experienced Teachers come to Harvard Forest to learn how to manage and represent project data from Schoolyard Eco. projects.
9:00 a.m. Whole Group check in.
Each teacher reports what data they will be working with during the session, and what they hope to accomplish. Staff explain their roles for the day.
9:20 a.m. Dr. Betsy Colburn Introduces Looking at Data
What teachers said about intro. presentation last year:
- It was great to hear where other people are with citizen science and to see that I have done some good work and that I have great areas for expansion of all of this too. I liked looking at examples of graphs with Dr. Colburn and talking about how we all interpret them. .
- It created a great mindset for the importance of data and the stories they can tell.
- It is always wonderful to learn something new that you can use immediately. And I liked how some of the participants talked about data being a story. I will use that in my practice.
- Just seeing other ways of presenting the data helps me bust out of my fixed point or line-scatter plots

9:45 a.m. Information Manager, Emery Boose shows new Schoolyard Teachers how to manage and enter project data


9:45 a.m. Betsy Colburn guides experienced Teachers in going deeper into representing project data.
Here's what teachers said about Breakout sessions:
- I was supported fully.
- It was very nice to have such experts on hand.
- Thank you for having so many ready to help out!!!!
- We had a great time together.
- Matthew was terrific helping us interpret our own pond data and instructed us on using pivot tables to create graphs. Excellent!
- All were incredible patient in giving us the tools to communicate science effectively to our students.
- Everyone is sweet, kind , responsive and professional

2:40 p.m. Teacher participants in levels 2 and 3 present their results to whole group
Is it worth taking a professional day from school???

- Today was very helpful since I practiced making graphs on excel and really did not know how to do that before today. I also worked with my own data and that was very helpful to work on making graphs that can help my students interpret the data from our school.
- boy, did I ever graph!
- I was able to get wonderful guidance entering my data and beginning to use the graphing tools on the websites. I simply ran out of time and would have loved to ask more question about graphing.
- I enjoyed hearing about the different graphing techniques and seeing the presentations from Betsy and Emery. I also enjoyed talking and sharing with other teachers over lunch.
- I never did this before so the practice was so helpful
- It was great to have time to do this work not isolated at school but in a community of like minded teachers and expert ecologists. In addition, I am very grateful for the ecologists taking the time to patiently explain.
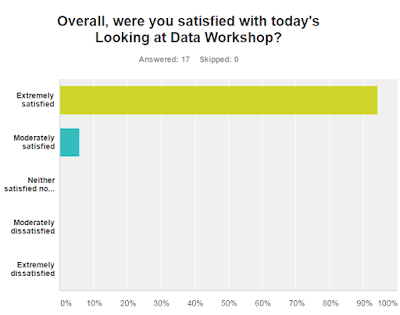
3:15 p.m. Workshop evaluation online-Survey Monkey
3:30 p.m, Workshop Adjourns
Related Links
Emery Boose Data Workshop Level I Presentation .pdf 2016 Data Management, Data Entry Intro.
Intro to Data Visualization 2015 Betsy Colburn Presentation.
Show Me a Picture, Tell Me A Story. 2016 Betsy Colburn Presentation
Compilation of Teacher-Created Graphs from Previous Data Workshop-Snow
Intro to Data Visualization 2015 Betsy Colburn Presentation.
Show Me a Picture, Tell Me A Story. 2016 Betsy Colburn Presentation
Compilation of Teacher-Created Graphs from Previous Data Workshop-Snow
Harvard Forest Schoolyard Ecology Database to download or graph project data.
Fall Phenology Summary and Graphs 2016.pdf . Dr. John O'Keefe's updated Phenology graphs.
Interactive Schoolyard Locations Map. 2017. Greta VanScoy.
Interactive Schoolyard Locations Map. 2017. Greta VanScoy.
Coming Soon
Later this winter, look for these additions to our data resources for Teachers:
- Schoolyard Ecology Field Site Map updated to include new schools who submit data.
- Branch To Tree Level Data Conversion Sheet
- Compilation of Teacher-Created Graphs from 2016 Data Workshop
- New Data Nugget Curriculum related to Carbon research at Harvard Forest
- Graphing Exercises for all projects posted to our website
- Announcement of Spring Workshop for Teachers
