Showing posts with label Dr. John O'keefe. Show all posts

Monday, May 4, 2020

Monitoring Buds Burst in the Time of Covid-19


Multiple approaches  to getting students observing the timing of leaf out in the time of school closures.


Hanover H.S. Student, Celeste Farrell monitoring Bud Burst at her schoolyard during school closure


From the Northern-most  Field Site, student volunteer based monitoring: 

I am taking data with Celeste's help with the 12 core trees so that we can continue determining the growing season.  She is standing at tree #13 (sugar maple) which is one of the trees that has been in the study the longest and we were practicing social distancing as we marked trees with flags and green twisty ties. I will be uploading data as I collect it.  Only the box elder had puffy buds.  The maples are next!  -Maryann Postans, Hanover High School, New Hampshire


From the Southern-most Field Site teacher led photo sharing approach:


Dr. Elisa Margarita, teacher at Brooklyn Technical School in New York,  has gone out for several visits to her class's field site at Fort Greene Park and taken photos of the buds to share remotely with students. She asks them to reply with the status of the buds based on the Harvard Forest protocol. 


Dr. Margarita is continuing to monitor, photograph and share remotely the bud/leaf out status of each of the study trees with students throughout the spring, until all study leaves have emerged. Stay tuned for her full documentation of bud burst on our website-coming soon.


Teacher, Jane Lucia from the Williston Northampton School, took a mixed approach.  

Remote Photos:   I was able to get over to school today and took some pictures. Though it is after the (HF Schoolyard Zoom Spring Workshop session 2 led by Dr. O'Keefe) workshop, These were taken April 17, 2020 on the Williston Northampton School Campus.


The white paper background was so helpful for focusing and seeing the buds. I also recorded the 6 buds for each tree on data sheets. I will make an effort to get out a few more times to capture leaf out as best as possible. I am also sharing this link with my students for observation, though I only took photos of one of the branches on each tree.

See more detailed teacher resources that Jane has shared for other teachers below!

Jane also incorporated a backyard monitoring assignment based on the recommendation of Dr. O'Keefe as seen in the data sheet below.


Special Backyard Protocol created by Harvard Forest Project Ecologist John O'Keefe for students monitoring trees in their neighborhoods:
See below for link to Remote Buds Data Sheet


Dr. John O'Keefe was the lead presenter at our 2nd Spring Workshop for Teachers Zoom Session.  

Here is what teachers shared about how they are adapting to doing Phenology outreach remotely:

Teacher Comments: 

I especially appreciate the updated/modified data sheets for our kids to explore the Phenology of the trees in their own yard or neighborhood! 

I realized today for the first time that the entire leaf must be showing to be considered leaf fully emerged.  I loved the mystery game and the ideas the teachers had Lucia - sketches and observations . I love the forcing the branch and the at home protocol with trees at students home. I might do versions of each over the next few weeks in addition to sending the kids the photos of their tree branches.

The workshop was very motivating and provided me with a wealth of ideas for my students. 

 I am more ready to take photos of branches using the white paper technique- with the tree names and dates on the papers! With this method, it seems more possible that I could share the photos with the students for observation and determination of the start of the growing season for their tree. 

I always learn from what the teachers are doing and sharing. They are so creative. I may not be able to use the information right away but it will be super helpful for the future 

It will take some time to figure out how to approach this with younger students. We certainly hope to give them a sense of what they would be doing if we were in school. 

I was not sure about how to go about this remotely but I think if I stay simple, it will be best as my students are young

 It clarified some ideas I had about students collecting data remotely. 

Clarification of the size and "puffiness" of buds was helpful; Thanks also for the online resources & guides 


Related Resources


PhenoCam Lesson Plans
The PhenoCam Network tracks seasonal change (Phenology) in biomes across North America using hundreds of web-cameras, with a gallery that can be explored and analyzed online.

Coming This Week: 

Spring Workshop Session 4 is scheduled for Wednesday, May 6th 3-4 p.m.  

Three Schoolyard Teachers will share how they are teaching Ecology remotely, including learning activities related to Phenology, Bud Burst, Tree and Animal ID,  Backyard Biodiversity.... 

To join us for this free webinar, Email Pamela at psnow@fas.harvard.edu   


Tuesday, December 20, 2016

Data Workshop in Review


18 Educators from Mass., Vermont and New Hampshire, gathered at Harvard Forest  on December 15, 2016 to  learn how to work with Schoolyard Ecology Data


Dr. Betsy Colburn Introduced Looking at Data 

  • It was great to hear where other people are with citizen science and to see that I have done some good work and that I have great areas for expansion of all of this too. I liked looking at examples of graphs with Dr. Colburn and talking about how we all interpret them. .
  • It created a great mindset for the importance of data and the stories they can tell.
  • It is always wonderful to learn something new that you can use immediately. And I liked how some of the participants talked about data being a story. I will use that in my practice.
  • Just seeing other ways of presenting the data helps me bust out of my fixed point or line-scatter plots


 Dr. Emery Boose introduced beginning Schoolyard Teachers to Data Management and Input


  •  Dr. Boose did a wonderful job starting from the beginning and being very patient and clear.
  • I especially enjoyed the importance placed on making copies and keeping track of metadata. This is an important step to stress with students as well.
  • I wish could have started entering data sooner in the day.
  • Needed more time working with my data.

Harvard Forest Staff  Mentored Teachers in Working with Project Data 


          •  I was supported fully.
          • It was very nice to have such experts on hand.
          • Thank you for having so many ready to help out!!!!
          • We had a great time together.
          • Matthew was terrific helping us interpret our own pond data and instructed us on using pivot tables to create graphs. Excellent!
          • All were incredible patient in giving us the tools to communicate science effectively to our students.
          • Everyone is sweet, kind , responsive and professional.


  • I learn best by hearing, seeing, doing, messing up, fixing and shouting "yeah!"
  • It helps me to see the exercise being done and to walk through it with a mentor helps be understand the process.
  • It was very valuable to have time to "do the work".
  • I was happy to have time to work on google docs and google sheets. I identified that I definitely need more practice manipulating data in this way.


----------------
  • Today was very helpful since I practiced making graphs on excel and really did not know how to do that before today. I also worked with my own data and that was very helpful to work on making graphs that can help my students interpret the data from our school.
  • boy, did I ever graph!
  • I was able to get wonderful guidance entering my data and beginning to use the graphing tools on the websites. I simply ran out of time and would have loved to ask more question about graphing.
  • I enjoyed hearing about the different graphing techniques and seeing the presentations from Betsy and Emery. I also enjoyed talking and sharing with other teachers over lunch.
  • I tackled Google sheets for the first time - and had it crying "Uncle!"
  • I never did this before so the practice was so helpful
  • It was great to have time to do this work not isolated at school but in a community of like minded teachers and expert ecologists. In addition, I am very grateful for the ecologists taking the time to patiently explain.
  • I have realized how much I need to learn about working on google sheets. This is a good thing, especially because this is the spreadsheet system available to students at my school and I am glad to know I need more practice before I introduce it to them.


  • we already are, we will continue. They will presenting the story of their tree to their classmates next week!
  • I think I will certainly show them graphs and other representations of the data. I'm not sure I will have them analyze data this year.

Related Links


Emery Boose Data Workshop Level I Presentation .pdf  2016 Data Management, Data Entry Intro.

Harvard Forest Schoolyard Ecology Database  to download or graph project data. 

Fall Phenology Summary and Graphs 2016.pdf . Dr. John O'Keefe's updated Phenology graphs.

Coming Soon


Later this winter, look for updates to our:

Dr. Betsy Colburn's Updated Looking at Data  Presentations
Schoolyard Ecology Field Site Map
Branch To Tree Level Data Conversion Sheet
Compilation of Teacher-Created Graphs from 2016 Data Workshop
Schoolyard Ecology Data Synthesis for the Buds, Leaves and Global Warming Project
Announcement of Spring Workshop for Teachers


Monday, December 19, 2016

Harvard Grad Student Looks at 12 years of Schoolyard Data

Harvard University Graduate student, Nate Edelman, was able to analyze  the data that thousands of K-12 students have contributed to the Harvard Forest Schoolyard Ecology program  over the past 12 years. 


So what is all the data showing anyhow?


Nate has created a series of graphs from the complex and large Buds, Leaves and Global Warming project dataset.  We are pleased to share these graphs with you now.

Until now, we have focussed most of our data analysis efforts on helping you, teachers, to understand our Project Ecologists' long term data as well as to represent patterns in your own site's data.  Last year, we were challenged by  The Long Term Ecological Research (LTER) network to do some synthesis of Schoolyard data over time and across sites to see if any patterns are evident.


The first six graphs here are looking at the timing  of leaf fall  for Sugar Maple (Acer Saccharinum), Red Maple (Acer Rubrum),  Black Cherry (Prunus Serotina), and Black Birch (Betula Lenta), Oak (Quercus) and Beech (Fagus) across Schoolyard Ecology field sites over 12 years.


How to interpret these graphs:

According to Nate Edelman, the blue lines on these graphs is a "smoothed Loess regression" calculated by R (Graphing program), which uses information from before and after each date to estimate the mean value for that date.  The grey area is the 95% confidence interval for that estimation.  The black dots are the calculated  means using only information from that exact day.  
Notice that the line drops towards the end of the season in these 2 figures above.  We would not expect the line to go down because more leaves would presumably fall at the end of the growing season. Please see Nate's comments followed by my comments  below to understand why the curve took this unexpected turn.  

Nate's thoughts about the drop in percent leaf fall of Oak and Beech at the end of the season:  
 I've plotted a histogram of the number of observations taken on each Julian data  and superimposed it on the leaf fall graph.What they show is that the number of observations reported dropped significantly at the end of the year, and that's when we get the unexpectedly low values.  I have an idea for how to get around this but didn't have time to test it out yet. 

Schoolyard Coordinator notes:  Please keep in mind that both species of Oak and Beech frequently retain leaves through much of the winter.  The leaves turn brown but many do not fall in the autumn when leaves from other species typically fall.  Some researchers stop monitoring leaf drop once most of the leaves have turned brown.  Our protocol asks to record oak and beech leaves as fallen after they have turned completely brown, in order to show that those leaves have stopped photosynthesizing and therefore the growing season is officially over for those leaves.  Sometimes, researchers forget to mark the leaves as "fallen" and this affects the ability to accurately graph the end of the growing season.    I'm interested to see that even Red Maple leaves fallen go down which must be due to far fewer observations at that time per Nate's notes above. 


Comparison of Schoolyard Data to  Project Ecologist, John O'Keefe's Data 


The next thing I did (above) was to take the two species we talked about, red oak and red maple, and compare them to John’s data. Qualitatively, the data for average 50 percent leaf fall and bud burst look similar, but when we look at the leaves on days, there are some fairly major discrepancies. In John’s data, there is a nice consistent separation of about 3 weeks of leaves on days between the species. However, the schoolyard data has some years in which the maple has a longer growing season than the oak, and in all cases the difference was much smaller.  
               
Below, I made the J.O.K.-style graphs and the leaf fall curves for each of the four species mentioned above, as well as black birch and black cherry
 -Nate Edelman


What is the spatial distribution of trees in the study?


Finally (Below),  I used the same species and tried to get a more geographical perspective. I combined the data by town, and made two maps for each species. One is the average number of leaves on days across the whole experimental period. The size of the dot corresponds to the number of years of data we have, and its color corresponds to the number of leaves on days.   
-Nate Edelman


 Below are map graphs of the most common 3-5 species with the larger circles showing where there are more trees of a certain species. I looked at the number of individuals of each species, and a natural cutoff seemed to be at 4 species (Red Oak, Red Maple, Sugar Maple, and Beech). I grouped all the trees by town, and plotted circles on those towns with sizes corresponding to how many trees of each species were used. I made two graphs – the first one is of unique trees, and the second is of all observations. So if a certain town had a single Red Maple, it would show as a small circle on the first graph, but if they had followed it for several years and had many records, it would be relatively larger on the second graph. I also included the total numbers next to the key. These graphs can unfortunately be a little hard to read because so many of the points overlap one another.
-Nate Edelman


The other graphs below show the change in leaves on days across the time period. I only included sites that had at least three years worth of data for this, and the color corresponds to the slope of the regression line. Positive slope (and red color) indicates an increase in growing season length. Negative slope (and blue color) indicates a decrease in growing season length. There is a big caveat here, which is that to get the growing season each year, I averaged the 50p bud burst and the 50p leaf fall for that town and took the difference. That would be fine if there was lots of data, but sometimes there were very few (or only one) trees, and they might be different trees for the bud burst date vs the leaf fall date! This is in contrast to John’s data, where we are looking at the exact same tree each season and each year.
                                                                                                       -Nate Edelman 


Stay Tuned for Multi Site Graphing Tool Next Year...
Harvard Forest Information Manager, Emery Boose, has proposed developing some cross site analysis capability using  Schoolyard Ecology Online Graphing tools.  In the meantime, give it a try using your graphing method and send us some examples!

Links for More Information on Harvard Forest Schoolyard Data Synthesis:


Dr. John O'Keefe's Phenology Graphs 2016.pdf to see graphs of 26 year dataset. 


Download Schoolyard Ecology Data from our online database to see all student generated data


Buds, Leaves, and Global Warming Schoolyard Ecology Project Information and Resources


Interactive Field Site Map to access data by school field site locations. This map will be updated this winter to include  schools who have joined our projects this year. 


Wednesday, October 5, 2016

Summer into Fall; Buds, Leaves and Global Warming Project Updates


Before going outside for further practice, teachers tried out their new field ecology resources to aid them in identifying samples of native tree branches.  Project Ecologist, John O'Keefe introduced the project protocol and related scientific concepts. Here teachers are beginning to identify and label the 6 study leaves on each branch, with help from Dr. O'Keefe and Mentor Teachers.


 Mentor Teachers, Louise Levy and Maryanne Rotelli shared some tricks of the trade that they have learned over several years of engaging their High School students in the Buds, Leaves, and Global Warming study.


 Here is some of what teachers said was valuable about the Summer Institute:


This was a great introduction to this study. It was made simple which truly adds to the likelihood of implementation and success.

This study will allow me to engage multiple levels of students at my school in this research.
How to use citizen science effectively in the classroom

Going through the protocol so that I know exactly what my students will be doing and what pitfalls they may encounter.

How to set up the project and advice from mentor teachers

The study of phenology and how students can document the relationship between biotic and abiotic factors (plant leaf drop & on with weather).

The experience of trying out the protocol from the student perspective

Tree ID and learning how quick and easy it can be to implement this into the classroom.

I think the facility was great and the mentor teachers were very helpful. Thank you for having them.

Moving into Fall.....


Students from New Hampshire, Vermont, Massachusetts, New York City, Connecticut, and Rhode Island have begun collecting data on leaf color change and drop at their schoolyards. 


 Students Students from Shore Country Day School in Beverly, Ma. measure leaf lengths for the first field visit only.


Students from Wahconah High School in Dalton Ma. up in the Berkshires (left)are monitoring their trees Teacher, April LesSage reported: The leaves are slowly changing.  We are just seeing some start this week.  


Brooklyn Technical High School Field Site in New York's Fort Greene Park


Students are out collecting data on leaves in the schoolyard of Wilson Middle School,Natick,Ma.

Views from Hollis-Brookline High School in New Hampshire (left),  and Williston Northampton School, Western Mass.( right).


Thanks  to teachers, Robin Koval ,April LeSage, Elisa Margarita, Jane Lucia, Kate Bennett,Maryanne Rotelli, Sheila Pogarian for sharing the photos above.

Foliage Images North to South  From the Phenocam Network


Bartlett Forest
White Mountains, New Hampshire
Phenocam Image
9-29-16


Harvard Forest, Petersham, MA  Phenocam 9-30-16

Austin Preparatory School, Reading, MA.   Phenocam Image


Academy Hill School
Springfield MA
Phenocam Image
9-30-16


Carey Institute
New York
Phenocam Image
9-29-16


The big question many of us are asking is:  


Will this summer's drought impact the timing and beauty of fall colors????

See the following video and article in Weather.com to get a look at what some experts are predicting:

https://weather.com/science/nature/news/new-england-drought-dry-fall-foliage

Related Links:


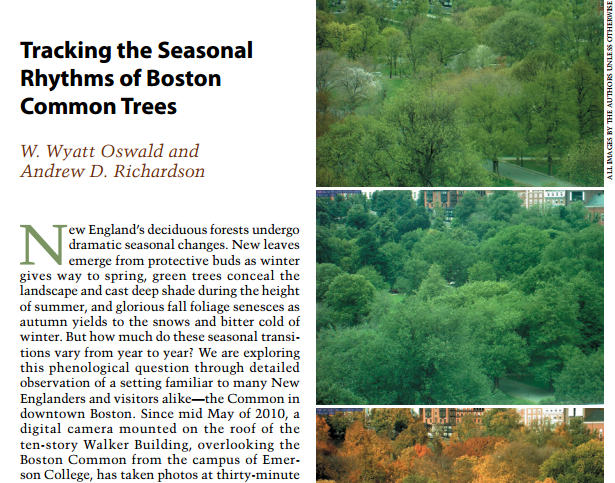
Tracking Seasonal Rhythms Article in Arnoldia
 by researchers, Wyatt Oswald and Andrew Richardson:  http://arnoldia Article.pdf


Buds, Leaves and Global Warming Schoolyard Ecology webpages: Buds-leaves-webpages-HF


Clickable Map of Buds and Leaves Field Sites:  map.fieldsites-HF