Showing posts with label links. Show all posts

Wednesday, October 5, 2016

Summer into Fall; Buds, Leaves and Global Warming Project Updates


Before going outside for further practice, teachers tried out their new field ecology resources to aid them in identifying samples of native tree branches.  Project Ecologist, John O'Keefe introduced the project protocol and related scientific concepts. Here teachers are beginning to identify and label the 6 study leaves on each branch, with help from Dr. O'Keefe and Mentor Teachers.


 Mentor Teachers, Louise Levy and Maryanne Rotelli shared some tricks of the trade that they have learned over several years of engaging their High School students in the Buds, Leaves, and Global Warming study.


 Here is some of what teachers said was valuable about the Summer Institute:


This was a great introduction to this study. It was made simple which truly adds to the likelihood of implementation and success.

This study will allow me to engage multiple levels of students at my school in this research.
How to use citizen science effectively in the classroom

Going through the protocol so that I know exactly what my students will be doing and what pitfalls they may encounter.

How to set up the project and advice from mentor teachers

The study of phenology and how students can document the relationship between biotic and abiotic factors (plant leaf drop & on with weather).

The experience of trying out the protocol from the student perspective

Tree ID and learning how quick and easy it can be to implement this into the classroom.

I think the facility was great and the mentor teachers were very helpful. Thank you for having them.

Moving into Fall.....


Students from New Hampshire, Vermont, Massachusetts, New York City, Connecticut, and Rhode Island have begun collecting data on leaf color change and drop at their schoolyards. 


 Students Students from Shore Country Day School in Beverly, Ma. measure leaf lengths for the first field visit only.


Students from Wahconah High School in Dalton Ma. up in the Berkshires (left)are monitoring their trees Teacher, April LesSage reported: The leaves are slowly changing.  We are just seeing some start this week.  


Brooklyn Technical High School Field Site in New York's Fort Greene Park


Students are out collecting data on leaves in the schoolyard of Wilson Middle School,Natick,Ma.

Views from Hollis-Brookline High School in New Hampshire (left),  and Williston Northampton School, Western Mass.( right).


Thanks  to teachers, Robin Koval ,April LeSage, Elisa Margarita, Jane Lucia, Kate Bennett,Maryanne Rotelli, Sheila Pogarian for sharing the photos above.

Foliage Images North to South  From the Phenocam Network


Bartlett Forest
White Mountains, New Hampshire
Phenocam Image
9-29-16


Harvard Forest, Petersham, MA  Phenocam 9-30-16

Austin Preparatory School, Reading, MA.   Phenocam Image


Academy Hill School
Springfield MA
Phenocam Image
9-30-16


Carey Institute
New York
Phenocam Image
9-29-16


The big question many of us are asking is:  


Will this summer's drought impact the timing and beauty of fall colors????

See the following video and article in Weather.com to get a look at what some experts are predicting:

https://weather.com/science/nature/news/new-england-drought-dry-fall-foliage
Related Links:


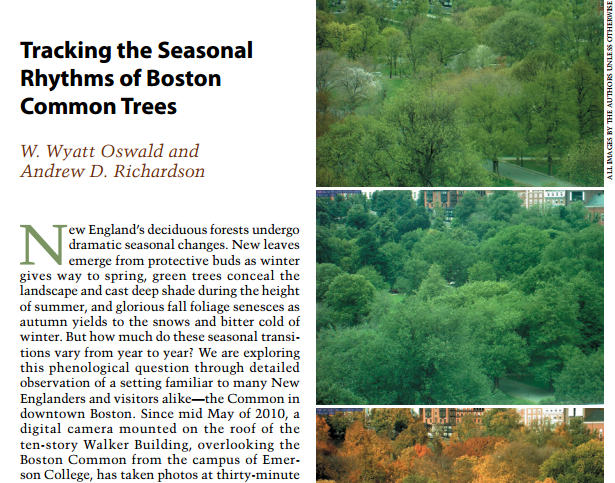
Tracking Seasonal Rhythms Article in Arnoldia
 by researchers, Wyatt Oswald and Andrew Richardson:  http://arnoldia Article.pdf


Buds, Leaves and Global Warming Schoolyard Ecology webpages: Buds-leaves-webpages-HF


Clickable Map of Buds and Leaves Field Sites:  map.fieldsites-HF


Friday, July 1, 2016

Pictures of Spring in Photos and Data

The Data is In; What did Spring Looking Like this Year?


On Friday we went up to the pool for the last time this year. We also returned some of the critters we had been keeping in the classroom. I also just uploaded all the data for this spring.

Judy Gibson, Francis Parker Charter School, Devens, Ma. 

---------------------------------------------------------------------------------------

NEW DATABASE FEATURE:

Field Site Photos can be shared in Field Site Description section of the online database.


Teachers can email their field site photos to Emery Boose to post on the online database at any time.
Excerpt from HF Schoolyard  Field Site Data Base with link to Photo Above

Schoolyard teacher, Janet Gordon has sent this photo of her field site from Tewksbury High School.  See all sites' field site data at:  http://harvardforest2.fas.harvard.edu/asp/hf/php/admin/k12/k12_sites_list.php


Views from New York City


Photos and Excerpts from Brooklyn Technical High School students led by teacher Elisa Margarita.  In her first year with the Schoolyard Ecology program, Elisa collaborated with veteran Schoolyard Teacher, Lise Letellier from Holyoke, Ma. to engage her students in analyzing and interpreting data.  


Mei Hua Mei's AP Environmental Science Harvard Forest Schoolyard LTER program Report. 


Explanation:
The question of global warming and climate change is the theme of this experiment and the effect of both may be demonstrated through this intensive research conducted by Harvard's long term ecological research. Although  the data presented above is only a small portion of the large platter of information presented to Harvard yearly, my data and the data collected this year is contributing to a larger look at the effects of climate change and global warming on our ecosystems. Climate change is creeping up on us, and we do not even realize it. Throughout the years, our ecosystems have been slowly changing and we may not have noticed because of these slow changes. With year after year of contributions to the study, Harvard is able to piece together a broad spectrum of the effects of Climate change; effects that may not to obvious to us in our day to day lives. 


Wrapping Up:
Through this experience, I was able to learn about collecting data and conducting research. It felt really great to be apart of a study that has been running for so long. It was truly an honor to be able to say “I am doing a project for Harvard.” Since this project started in the beginning of APES class, it was a good introduction to the skills we would need for the rest of the year. For example, we learned how to collect data, take measurements, identify trees, make observations, handle tools, work as a group, and more. So, not only was the Harvard Lab an honor to conduct, it was also a vital introductory project that would lead us to the rest of the course with an understanding for conducting research and working as scientists in a group. 
This project was very eye opening and interesting to conduct. However the class and I encountered some difficulties. Since we did not have(past) data for our trees, we had to use data from another school. This presented a loss of purpose for the assignment because a large portion of our report went to analysing information for a tree we did not observe. This problem can be easily fixed by entering the data for our trees onto the Harvard database. 
My favorite part of this project was having an opening and closing for our APES year. The Harvard Project was our opening assignment for the school year and one of the last assignments in the closing of the year. We started this project with all of our Firsts of the year. Our first time going to fort greene for class, our first time doing a lab, and our first time working in groups with kids that we barely knew. And by the end of the year, when we went out again to take our Spring data, it was our two hundredth time going to fort greene for class, our nine hundredth lab, and our fiftieth time working in groups with our closest schools friends.
-----------------------------------------------------------------------------------------------------------

Mohamad Amin                                                                                                                6/12/2016
AP Environmental Science

Harvard Forest Schoolyard Ecology - American Elm and Red Maple

            Our tree was an American Elm, or Ulmus Americana, it is a deciduous tree with a range all across the eastern United States, it favours a whole range of habitats but generally likes being near areas with lots of water. It is a highly resistant tree, the common enemy of this tree is the Dutch elm disease. It has elliptic to lanceolate leaves that are pinnate and serrated, the leaves are arranged alternately. This tree has a long growing season and can continue growing into the late fall, unaffected by the loss of sunlight.
            This experiment was a group project, as a group we were free to select a tree and we chose the American elm. During the autumn we measured the rate at which the leaves of the tree changed colour and when/if the trees finally separated from the branch. This was a weekly task and continued until winter. Once winter was over and spring began, the project restarted with a different focus; we were to measure the buds of the tree and see how long it took to begin sprouting new leaves.


            Due to complications involving our data, I was not able to complete this project using my own data. Instead I had to use data from the Harvard Tree database. As of such I chose a Red Maple from the data taken by Holyoke Catholic High School. The Red Maple is another extremely hardy species with a varied habitat.
The data taken from Holyoke indicated that this tree quickly bursts and gets it leaves during the end of April and beginning of May. The Red Maple would go from no leaves at all during the week of April 20th, it would have seventy percent budburst during the following week and by the tenth of May it would be fully opened.


 Leaf Length follows similar trends to the budburst. The tree is completely devoid of leaves until the end of April but once the buds have burst, the  leaves grow rapidly. They reach 2 centimeters by the end of April and quickly jump up to the 10 centimeters by around the beginning of May. After it has reached ten centimeters, it quickly flattens out and stops growing. This is indicative of quick growth and it would mean that Red Maples can quickly establish themselves.


Trends can also be seen with the changing of leaf colours for the Red Maple. The Red Maple seems to have a slight on or off switch with the colour change. For the majority of the year, since it gains its leaves they maintain a solid 2.0 tree color. However during the week of 23 October, the tree undergoes a radical shift and the leaf colour shifts radically. It gains its famous red coloration and is part of the standard colour changing during the autumn season. The colour changes rapidly from green to red, once the change begins and completes itself within the week, the colouration does not change much anymore.

The amount of leaves that have fallen from the trees followed similar trends too. The tree would be completely fine for most of the year until a week in October. The week of October 29th saw the Red Maple completely lose all of its leaves. It was not even a period of a week, it was closer to four or five days, but in that time the Red Maple managed to go from 0% leaf lost to 100% leaves lost. During this time, Data was only taken twice between the time it went from 0 to 100 percent lost. At one point it was at 40 percent but by the next time of data collection, all of the leaves had fallen.

This project was a complicated a long term one. The American Elm tree that we originally selected was a major part of it, we got a lot of data on it but the fact that it was not very organized (the Spring data was submitted and we didn’t have a backup) meant that it could not actually be used for this report.


Spring Budburst Data Looks Like this from across 4 Schools: 


Westfield, Mass.  


Easthampton Mass.

  
 Holyoke Mass.


Worcester, Mass. 


Explore more data from this year


To see all data entered to our database this year go to:


download Schoolyard data


To see sites and their data on our interactive site map go to: 

Interactive site-data map


To graph data from any of our Schoolyard field sites, go to:

Online graphing tool


Stay Tuned for part 2 of Looking at What Spring Data Looks Like..from Harvard Forest Ecologists and Schoolyard resources..Coming Soon

Tuesday, April 19, 2016

Teachers Steal the Show at Spring Workshop

Schoolyard Ecology Teachers Took Center Stage at Our Spring Workshop for Teachers on March 31st at Harvard Forest


Beginning with introductions, teachers had so much to contribute and update on...we ran over well over the time I had allocated in the agenda.  I could have cut folks off sooner, but it was clear that the entire learning community of classroom teachers, environmental educators and scientists was all ears to hear what each teacher had to share.

Hemlock and Buds groups each met in breakout groups before heading outside.


Into the Woods

Teachers actively contributed to field discussions as well.  Scientists allowed the teachers to lead the focus of the discussion with their many questions and comments about field protocols, seasonal changes, physiology, etc.


Teacher Presentations


The afternoon was highlighted  by teachers and naturalists formally presenting the way they are engaging children in field ecology projects.


J.R. Briggs Elementary teacher, Katherine Bennett, and Austin Preparatory School teacher, Maria Blewitt each shared the ways they are deepening students' understanding of the science of Phenology.  Both teachers have contributed to the Buds, Leaves and Global Warming study over several years. Both also host web cameras called "Phenocams" on the roofs of their schools to track the greenup and green down of the tree canopy near their schools.  Kate shared some of the impressive array of educational resources that she has helped develop for the Project Budburst webpages. 


 Kate shared some of the impressive array of educational resources that
she helped to develop for the Project
BudBurst webpages.

Kate collaborated with Phenocam scientist, Andrew Richardson, along with Project Budburst coordinator, Sandra Henderson and team to develop these in depth, colorful activities and lesson plans that help students to understand the science of Phenology.


Maria Blewitt shared the step by step process she used in graphing the Phenocam data provided by the Phenocam at her school in Reading, Ma.    


Mass Audubon Educators, Sally Farrow and Erin Pitkin, then updated us on how they are helping students of all abilities engage in both the Vernal Pool and Phenology studies at Drumlin Farm and Lowell schools.  Sally showed us a variety of graphs she is sharing with students that tell the story of the hydrology of the vernal pools and ponds at Drumlin farm where over 5,000 students have participated in the the Harvard Forest Schoolyard vernal pool  study over 8 years.


Erin Pitkin, in her first year working with the Schoolyard Vernal Pool and phenology studies, shared a set of visual resources she developed to allow a diverse range of learners to access the scientific protocol.

A number of schools provide student "Eco Monitors" who regularly collect data for Harvard Forest Schoolyard Ecology projects sited at Drumlin Farm in Lincoln, Ma.  Erin showed how she is adapting and creating tools for students of diverse abilities to participate in this work.


Holyoke Catholic High School Teacher, Lise Letellier lead the charge with her impressive and comprehensive telling of her 5 year journey through Schoolyard Ecology.  See my previous blog entry for more on that presentation along with the related links below.


Survey Comments from Workshop Participants: 


  • All of the presentations were well done! I am excited to take the great ideas and implement them into our program.
  • all of the teacher presentations were excellent.
  • teacher talk time was sooo helpful! Great discussion about what else to keep track of since yearly change is not significant enough to graph. So great to learn about phenology and phenocam resources,
  •  All the presentations helpful and presented new information and inspiration which will benefit our programs.
  • Kernals of gold nugget in each and all of them!
  • Lise gives me hope that I, too, can have my students tackle data!
  • The opportunity to meet and speak with the other teachers and hear the presentations gives me hope and inspiration and definitely renews my passion.
  • both the walk and the teacher presentations definitely renewed my passion.  I hope to eventually get to the point where I can contribute to the discussions and presentation.
  • Today's presentations were mostly applicable to all protocol and made new resources accessible and offered ways they can help us teach the standards. 


To see teacher presentation slides and hear audio on Adobe Connect, go to: 


To access PDF documents of teacher presentations, go to:


Bennett,K.Taking Phenology Education to the Next Level.pdf

Blewitt,M.Using the Phenocam Website with Your Students.pdf

Letellier, L. Five Years of Data Presentation.pdf

Farrow,Pitkin. Eco. Monitoring for All Learners.pdf


To access the complete Survey Monkey Spring workshop evaluation, go to:


To follow up on any questions or comments about this Blog post or Harvard Forest Schoolyard Ecology, email:


 Pamela Snow


Or add your comment on this blog below...